Disperse Progress Tools

Progress Tools: Weekly Pace
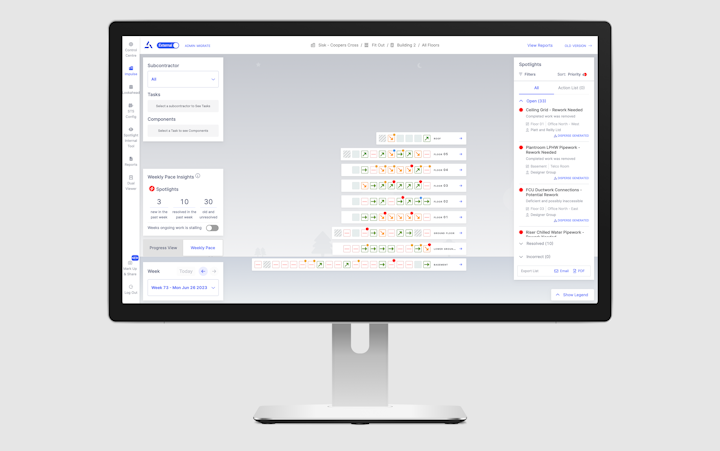
How was the week? Which activities are blocked? For how long?
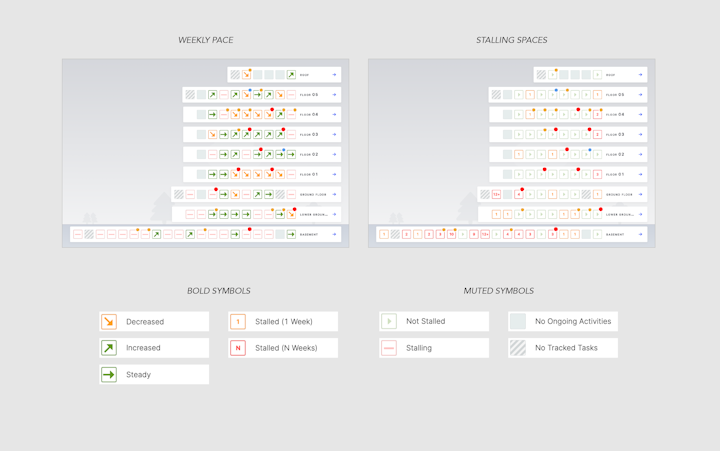
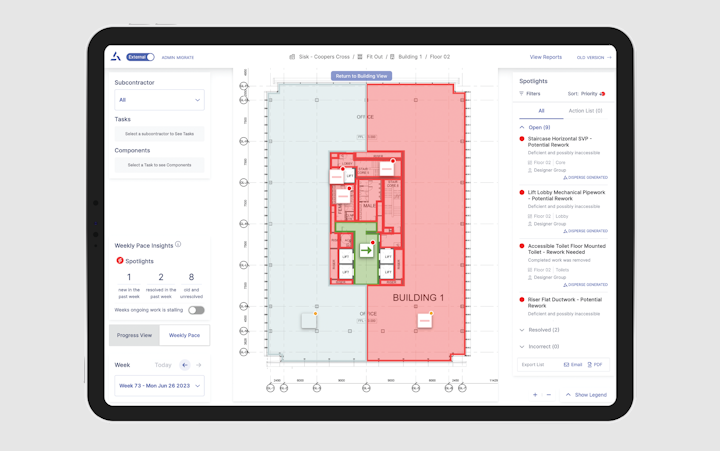
Weekly Pace in Floor Plan View
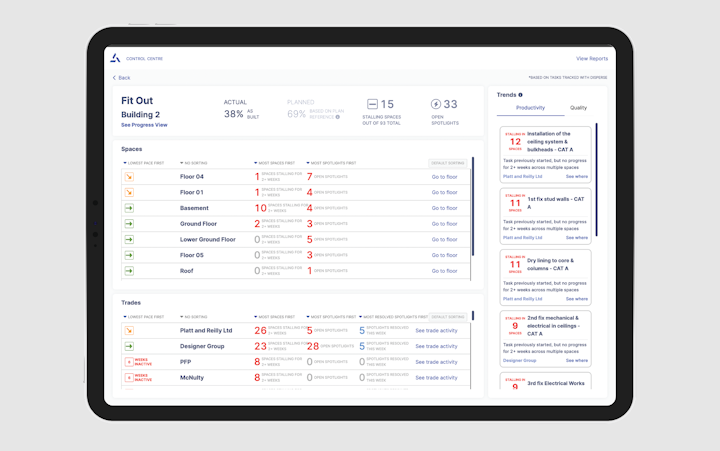
Progress Tools: Control Center, stalling spaces stats
Disperse is a productivity platform for the construction industry. It emphasises data visualisation, making on-site activities easy to understand, prioritise, and act upon. Using site scanning and visual analytics, Disperse provides ready-to-use solutions that require minimal client input, promoting lean construction processes. In this initiative, we introduced Weekly Pace as a feature of "Impulse", a visual progress tracking and issue signalling tool. Weekly Pace aims to dynamically boost productivity by providing insights into weekly events on the site. It answers questions like: What was completed this week? Is an activity blocked? If so, for how long? Is work picking up or slowing down?
Client:
Disperse, Construction Site Teams
Solution:
We learned that our users approach positive and negative trends with a different mindset. They enjoy viewing positive trends but need to concentrate on the negatives. For effective data visualisation, we designed two separate views for the user to focus on - one that displays the weekly pace and another that highlights the details of any stalling. Accordingly, we used a combination of bold and muted symbols to draw attention to the most relevant data within each view.
Impact:
Progress insight tools are aiding customer prioritisation and decision-making, resulting in a 60% increase in power users.